Do bond maturity dates influence pricing?
In addition, the longer a bond’s maturity date, the greater the impact upon a bond’s market price from a change in interest rates. This is because changes in current interest rate levels have a greater impact upon long-term maturities than on short-term bonds. Investors should understand that the market prices for bonds are more volatile when there is a change in the bond environment – interest rates, risk of default, inflation levels, etc.
In addition, investors generally expect to earn a higher interest rate or yield when investing in bonds with longer maturity dates.
The longer a bond’s maturity date, the greater the probability that the bond will experience changes in inflation levels and credit risk assessments. Because of these potential influences investors demand a higher coupon rate or yield for bonds with a longer maturity date.

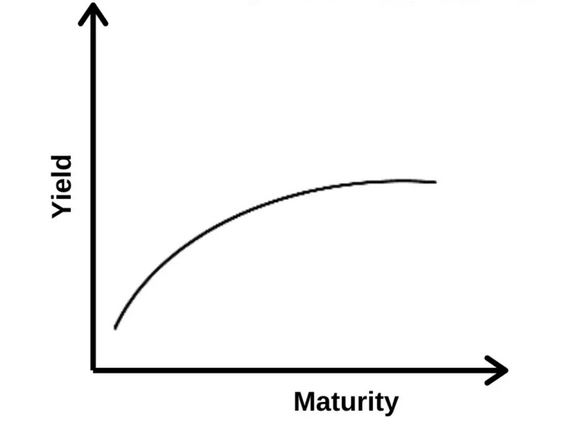
The above relationship between bond interest rates and the length of maturity is often expressed in a chart form known as a yield curve.
A yield curveis a graph constructed by plotting the current interest rates for bonds of various bond maturities, with interest rates on the Y-axis and time to maturity on the X-axis.
A yield curve is considered to be normal or ascending when curve moves from the lower-left corner to the upper-right corner.
At certain points in an economic or business cycle, the yield curvewill change from the normal or ascending pattern to a flat or inverted chart pattern. For more information about yield curves, see the section “Yield Curves and the Economy”.
Related Questions
- What are some common features associated with bonds?
- What are some terms associated with bonds?
- How does the bond market work?
- How are bonds priced?
- Where can I go to get up-to-date trading information for bonds?
- How do interest rates influence a bond’s market price?
- Does inflation have an impact on bond pricing?
- Do credit and default risks impact bond prices?
- What are the definitions of the corporate credit ratings from the DBRS?
- What is the DBRS rating philosophy?
- What is bond liquidity?
- What does it mean to purchase a bond at a premium?
- What does it mean to purchase a bond at a discount?
- What is accrued interest income?

