
Canada yield curve
Yield curves are basic tools for trading on capital markets, and both investors and banks use them in important ways, though in different ways. Yield curves are useful tools that can be used to tell a lot about the economy.
Interest rate structures aren’t easy to understand for everyone, but they aren’t hard to figure out either.
Signs of a coming recession?
Current economic forecasts for the euro zone are not exactly optimistic. It seems doubtful that the European Central Bank will raise interest rates and initiate a short-term interest rate tightening at this time. Nonetheless, there is a possibility of a recession if investors increasingly rely on long-term bonds due to economic anxieties and pessimistic forecasts of economic growth, consequently reducing their returns.
Inverting yield curves is not necessarily indicative of an impending recession. Nevertheless, this was frequently the case in the past.
Shapes and effects of yield curves
What is a yield curve?
A yield curve is a graph that depicts the relationship between the maturity of a bond or loan and its interest rate.
Yield curves provide useful insight into the relationship between various maturities and interest rates.
From the interest rate structure, investors can determine in which term of bonds they should invest. If interest rates are declining, investors should invest in long-term or at least intermediate-term bonds. If, however, higher interest rates are impending, it makes more mathematical sense for investors to exclusively make short-term investments.
The yield curve is used by banks to determine the conditions for fresh offerings. This takes place on the primary market or emission market. The yield curve is used to label bonds and loans that are already in circulation in the secondary (circulating) market.
Changes in the structure curve in the primary and secondary markets result in price fluctuations under the current market conditions.
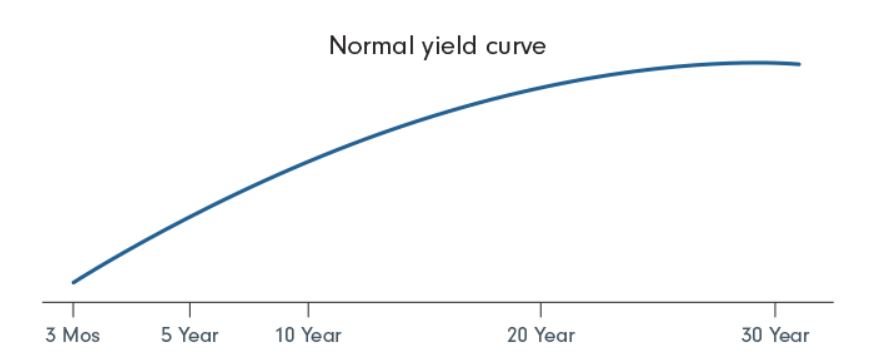
The Normal yield curves
Assume that economic expectations are optimistic and that the desired normal scenario exists. The longer the duration, the greater the rate of interest and yield. This produces a yield curve that follows a “normal” trajectory. It is easier for investors and issuers to plan, for investors in terms of returns and for issuers in terms of to-be-determined emissions.
The steeper the slope of a structural curve, the greater the economic growth forecasts of market players. Typically, a steep yield curve accompanies the conclusion of a recession. Investors are now again optimistic about the economy’s recovery, and these optimistic predictions are influencing bond yields.
Accounts for fixed-term deposits are exemplary of “typical” yield curves. The golden rule is that long-term savings are rewarded with growing interest rates.
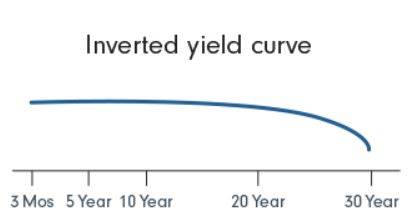
Inverse yield curves
Inverse yield curve is the opposite of regular yield curve. Consequently, this is also known as a negative structural curve.
Weak economic forecasts have a negative impact on bond yields, resulting in a decline in short-term interest rates. Falling yield curves can provoke fears of a recession, which can be detrimental to an economy’s reputation.
Flat yield curves
Interest rates on both short- and long-term maturities are balanced. With medium-term bonds, there may be a “hump” and, thus, slightly higher interest rates than with shorter- or longer-term maturities. A flat yield curve may indicate that the evolution of interest rates follows an inverted structure. This is not have to be the case, but it can be.
Final word
The shape of the Canadian yield curve is used to determine the current and future strength of the economy, and the Canadian yield curve is recognized as the “benchmark curve” in comparison to all other yield curves. In general, yields on Canadian government bonds and other securities are among the lowest since they are guaranteed by the government’s full confidence and credit. This enables bond investors to compare the Canadian yield curve with yield curves of riskier assets, such as those of provincial bonds and A-rated corporate bonds. The difference in yield between the two is known as the “spread.” The closer the yields are, the more willing investors are to assume the risk of a non-government-backed bond. In general, the spread widens during recessions and narrows during recoveries.