
An inverted yield curve is the rarest of the three shapes and is thought to forecast an economic slow down or recession. This shape is characterized by higher interest rates for the shorter-term bond maturities.
Historically, an inverted yield curve results after a series of short-term interest rate increases by the government’s Central Bank. In the Central Bank’s efforts to control the positive rate of inflation in the economy, they raise the short-term interest rate in an effort to slow economic growth. An inverted yield curve describes a bond market where investors receive a greater reward to invest in short-term bonds than in longer dated maturities. At the same time, businesses and individuals find it difficult and expensive to finance their day-to-day operations and longer-term investments. This in turn leads to a slowing economy.
Because inverted yield curves are thought to presage an economic slowdown or recession, investors transfer this outlook to their expectations for stock markets.
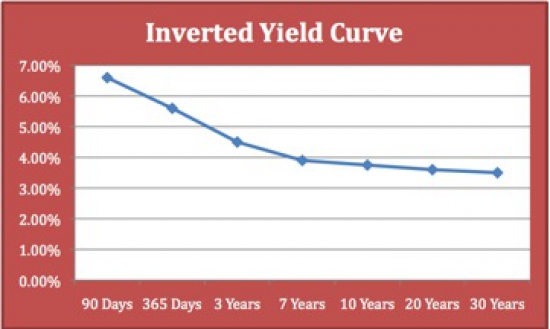
In addition to the shape of the yield curve and the steepness of the curve and the level of interest rates, investors should also observe the actual level of interest rates. For example, look at the two inverted yield curves below:

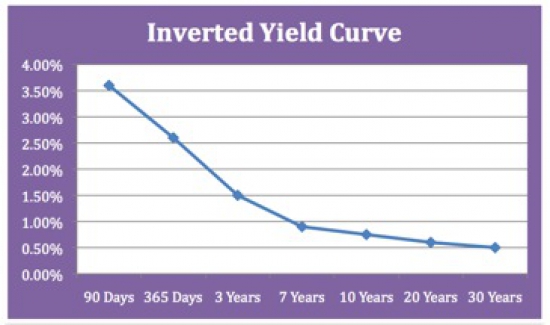
Although both yield curves are obviously inverted and thereby predicting an economic slowdown/recession, the bottom curve is indicating a much lower expectation for future positive inflation. This may be indicating that any future economic recovery will be very weak and therefore the economy will not experience a return to a historical inflation level. This could have longer-term implications for future asset prices – stock market and real estate, and the economy as a whole.
Investors should also remember that the yield curve is viewed as a tool to assist in forecasting economic phases or cycles, not stock market phases or cycles. Stock market cycles have a varying history of preceding and lagging economic cycles.
In addition, as long as inflation remains positive, we view it normal for short-term bond interest rates to be lower than longer-term bond maturities. If on the other hand inflation becomes negative (deflation) as it did through much of the 19 and early 20 century in the United States, then a flat or inverted yield curve may be viewed as the normal curve shape.