In order to invest successfully, you have to know how much your investments cost. How can you maximize your investing success if you don’t know how much you are paying? How do you know if you’re paying too much? Did you know that some investments have hidden costs? As the old saying goes, “The more people between you and your money, the harder it becomes to invest with success.”

That’s why you always want to ask yourself two things when investing your money:
- What is the cost to me for each investment?
- Who’s getting my fee?
Once you can answer these two questions you will have a better understanding of the costs associated with each specific investment type, and the cost of your investment over the long-term. The following section provides answers to some commonly asked questions regarding investment costs.
What type of investment costs must I pay?
Each time you buy or sell an investment you will incur one of the following investment costs (or fee):
- a commission per investment at the time of purchase and sale
- an annual fee based on the value of your investment portfolio (monthly, quarterly, or annually). Usually paid as a percentage cost, your fees can range anywhere from 0.00% to 3.5% per year, depending on the investment of type and account. So be sure to calculate this cost for each investment and account.
- a built-in fee (i.e. a hidden cost that is part of the purchase structure where you may not be aware of its true cost. Mutual funds, segregated funds, Exchange Traded Funds (ETFs), bonds, Principal Protected Notes (PPNs), Structured Notes, and Guaranteed Investment Certificates (GICs) are a few examples of investment types with built-in fees.)
Do the math: What is the cost of your investment over the long term?
Perhaps one of the least understood facts about investment costs is the need to look at costs over the long-term. In other words, in order to truly make successful investments, you must do the math of calculating your investment costs over the long term as some investments have annual fees that can add up over the long-term. Only when you have calculated an investment’s annual investment costs, can you safely satisfy yourself that the costs are reasonable given the benefits received.
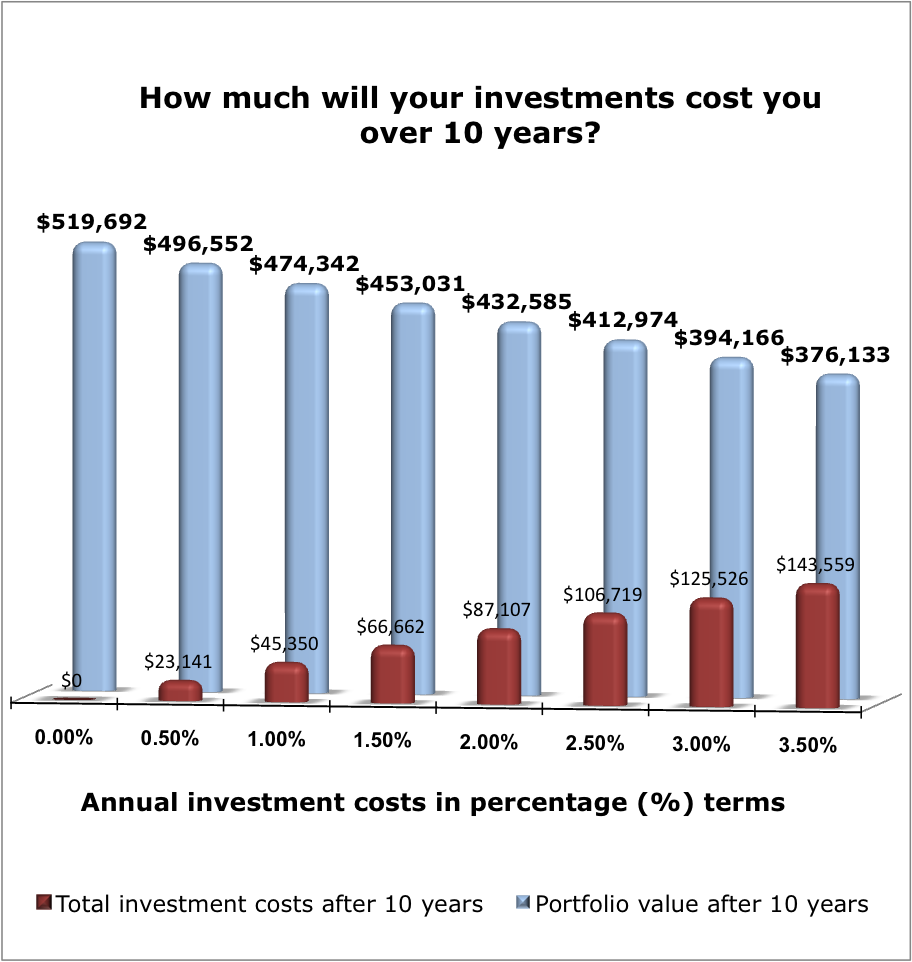
Note: For the majority of Canadian investors, the bulk of their investment costs will be charged in the forms of Management Expense Ratios (MERs) and annual investment management fees. Both of these costs are typically expressed as a percentage of your investment’s value. For example, when you are researching the costs charged by mutual, segregated, and ETFs, you will find that the costs are expressed as an MER percentage, such as 2.40%. The blue and red (poles) in the chart below reflect the costs as a percentage of the investment portfolio and also the dollar value of the percentage costs.
Example: Let’s say you have a $200,000 investment portfolio invested 100% in stocks.* As the chart below demonstrates, percentage investment costs may seem small, but they can impact your investment success big time, as they say. So, if you’re a novice thinking about investing for the first time, you want to pay attention to the difference in percentage costs (as illustrated at the bottom of the chart). While these percentage costs may not appear to vary greatly, in fact these small variances will have a huge impact on your investment costs over the long-term. For example, if your investment costs are 3.50% per year, then over a 10-year time span, your investments will cost you a lot of money ($143,559.00!). Just think how much money you could have saved if you had shopped around for a better percentage cost! Or, as another example, the cost difference between a mutual fund charging you an MER of 2.50% and an ETF charging an MER of 0.50% appears small, but over a 10-year time span the mutual fund would cost you $83,578.00 more than the ETF. Wouldn’t it be nice to have $83,578.00 more in your pocket as you head into retirement? Take a look:

*Note: The chart above assumes a $200,000 portfolio has been invested 100% in stocks (S&P500-Large Cap.) that according to Russell Investments has achieved an average annual rate of return, from 1974 – 2008, of 10.02%, with a standard deviation of 18.35%. Visit our Portfolio Design – Step 7b, Single Asset vs. Multi-Asset Portfolios for a more in-depth discussion of Multi-Asset Portfolios.
What are the different investment costs for each investment type?
Very simply, different types of investments have different costs. For the novice, it is important that you familiarize yourself with the cost basics of these different investment options. Some types of investments are known as more safe bets for investing with very clear investment costs, while some have more cloudy cost attributes. As with everything else you buy, it is a buyer-beware market when it comes to investing.
In the following sections we try to spell out the most important cost features of various investment types to help you make a more informed decision when it comes to making an investment:
- Mutual Funds and Segregated Funds
- Exchange Traded Funds (ETFs)
- Common and Preferred Shares (New Issues)
- Bonds and Debentures
- Guaranteed Investment Certificates (GICs)
- Principal Protected Notes & Index-Linked GICs
- Annual Fee Accounts
The following chart provides a summary of the different investment categories and a few of the investments associated with each category.
| Investment Category | Investments in each category |
|
Cash and Cash Equivalents |
|
|
Fixed Income |
|
|
Growth |
|
|
Hybrid |
|


